
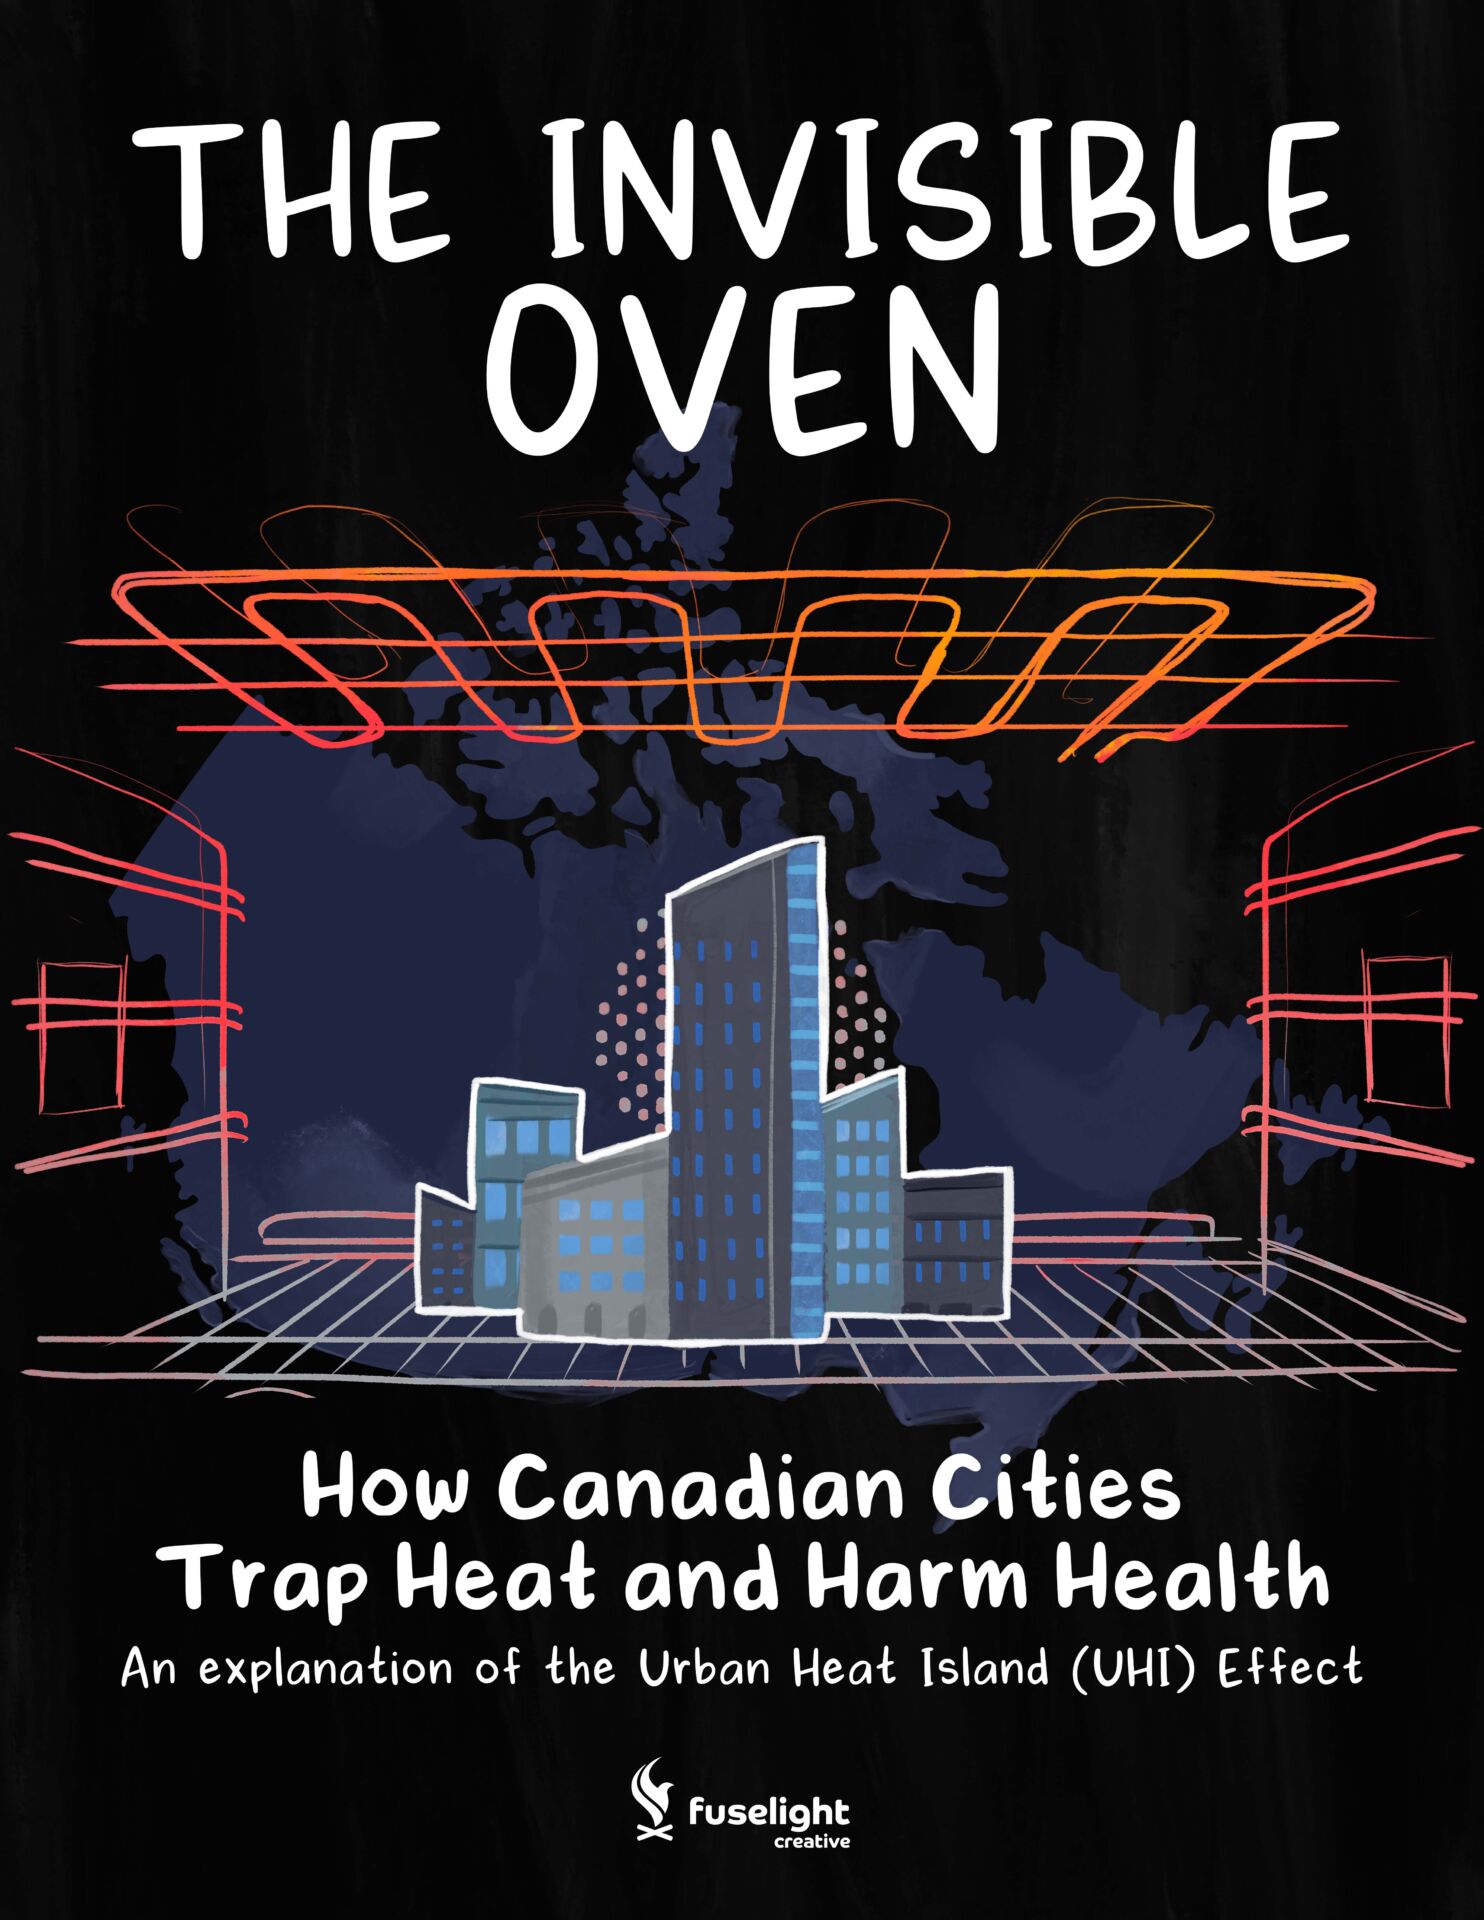
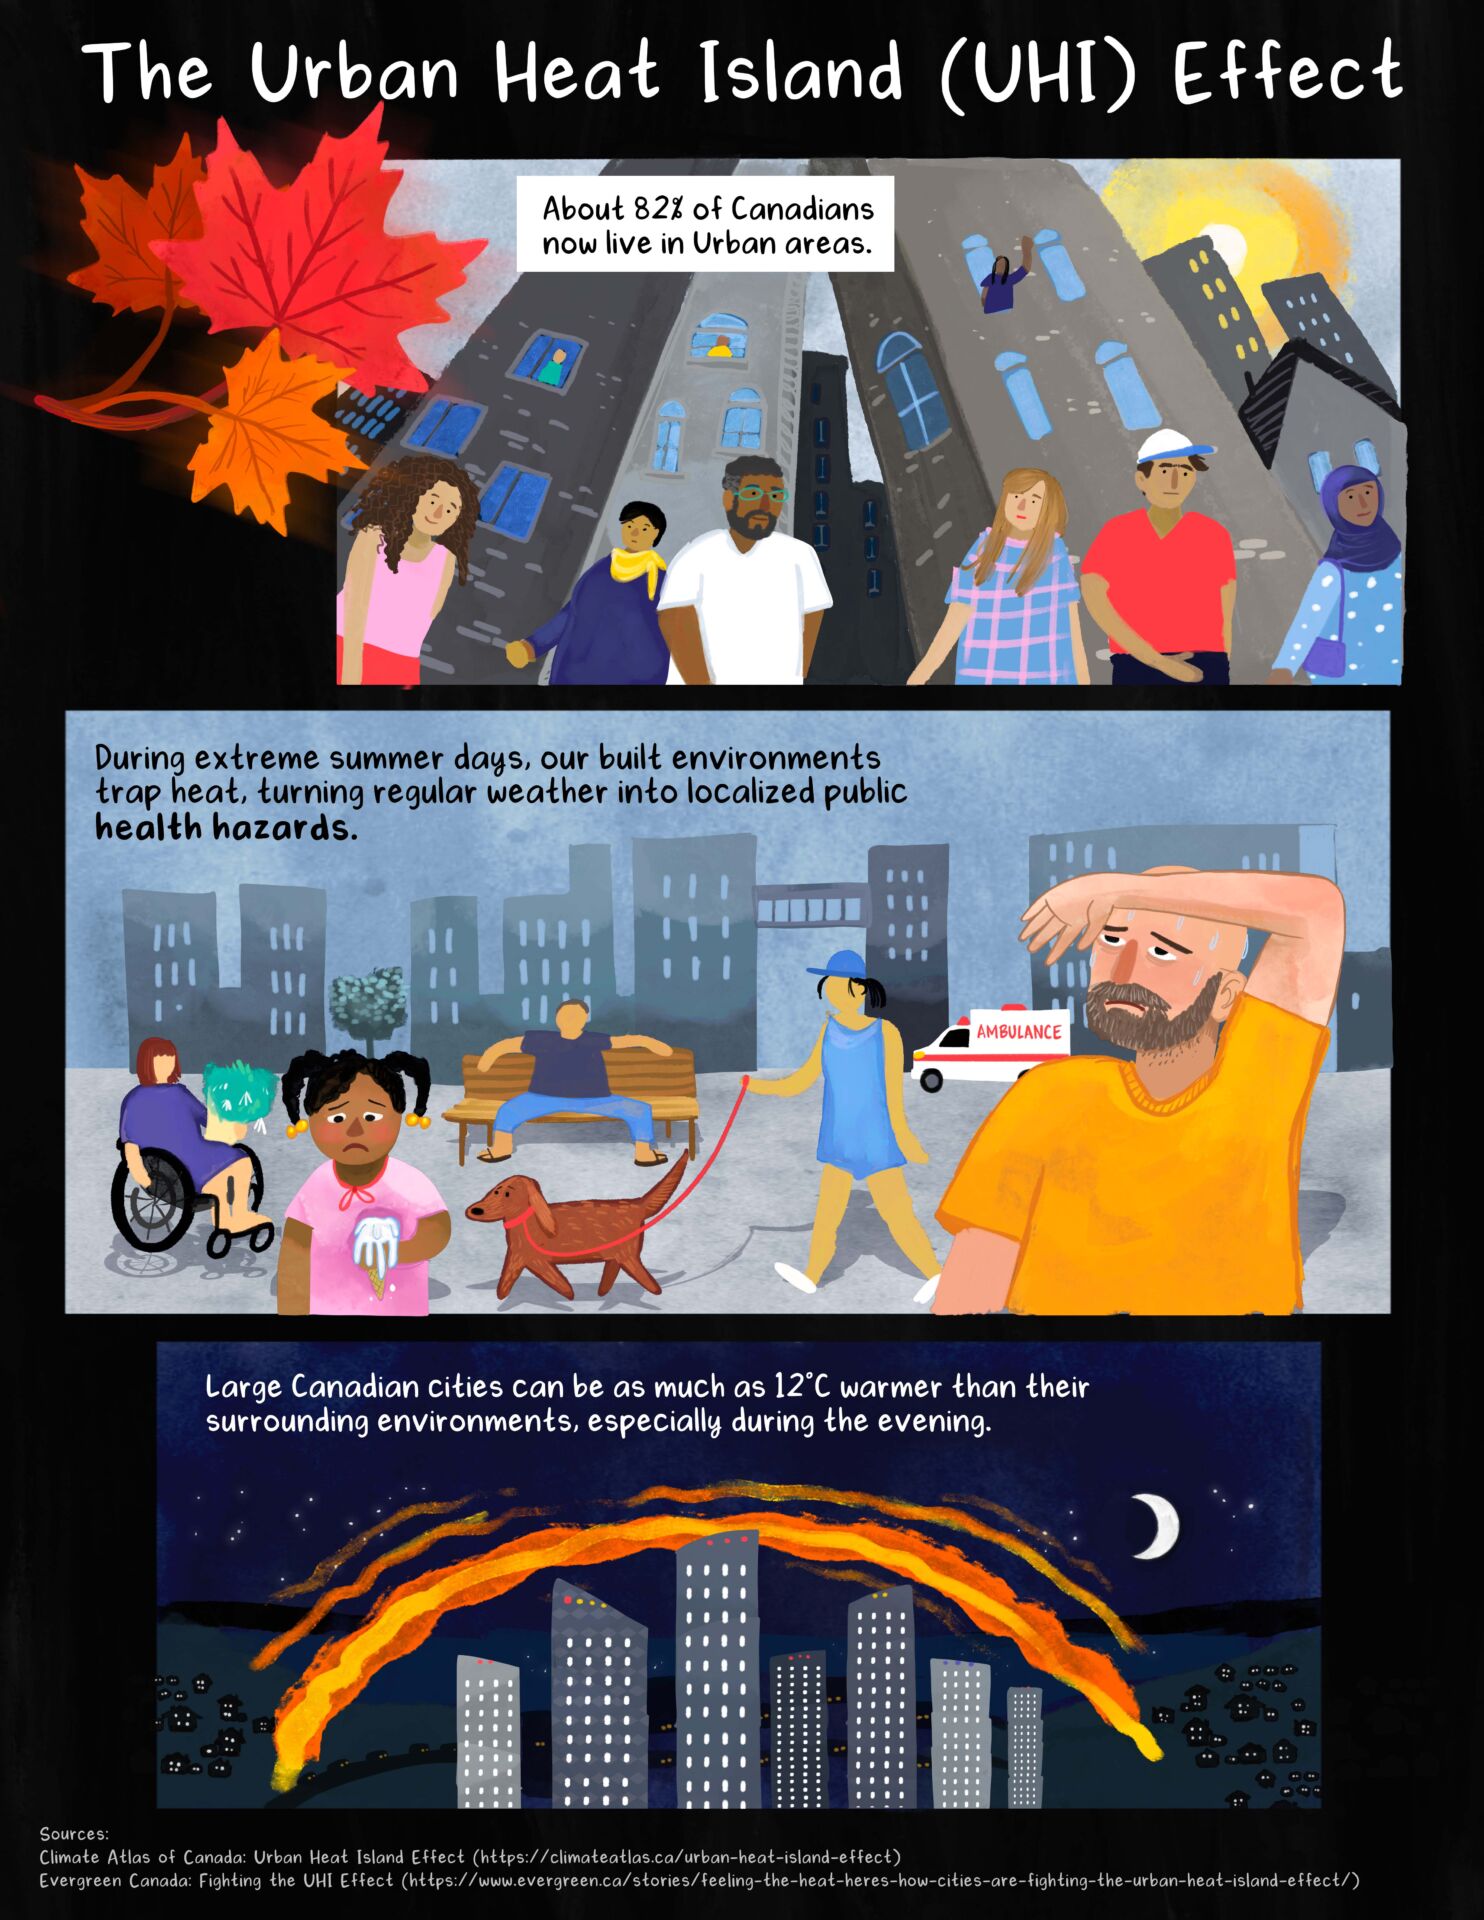
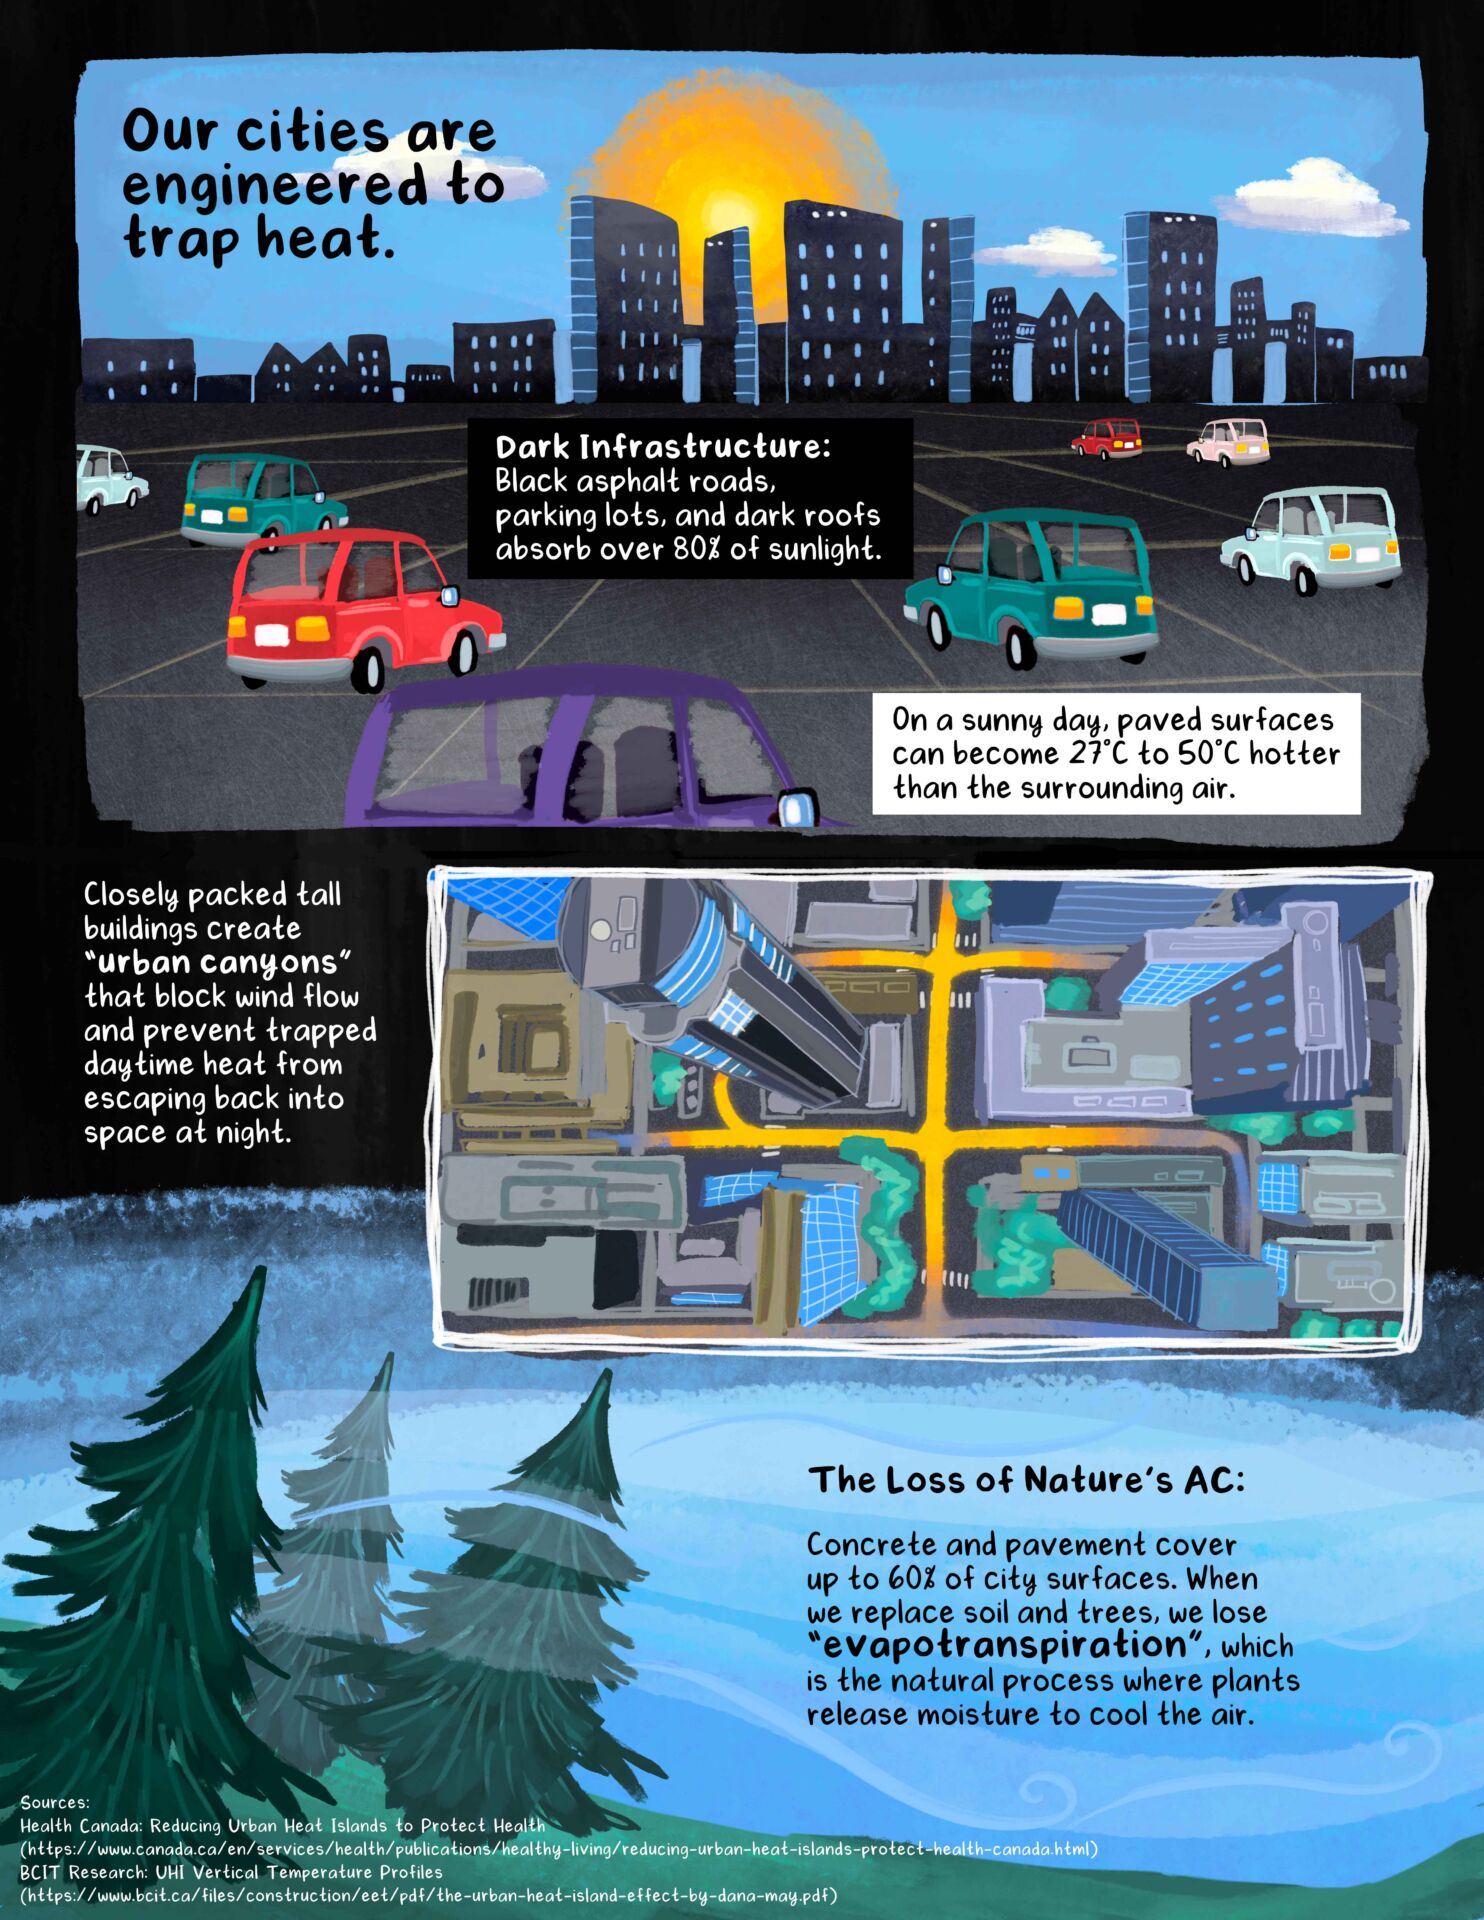
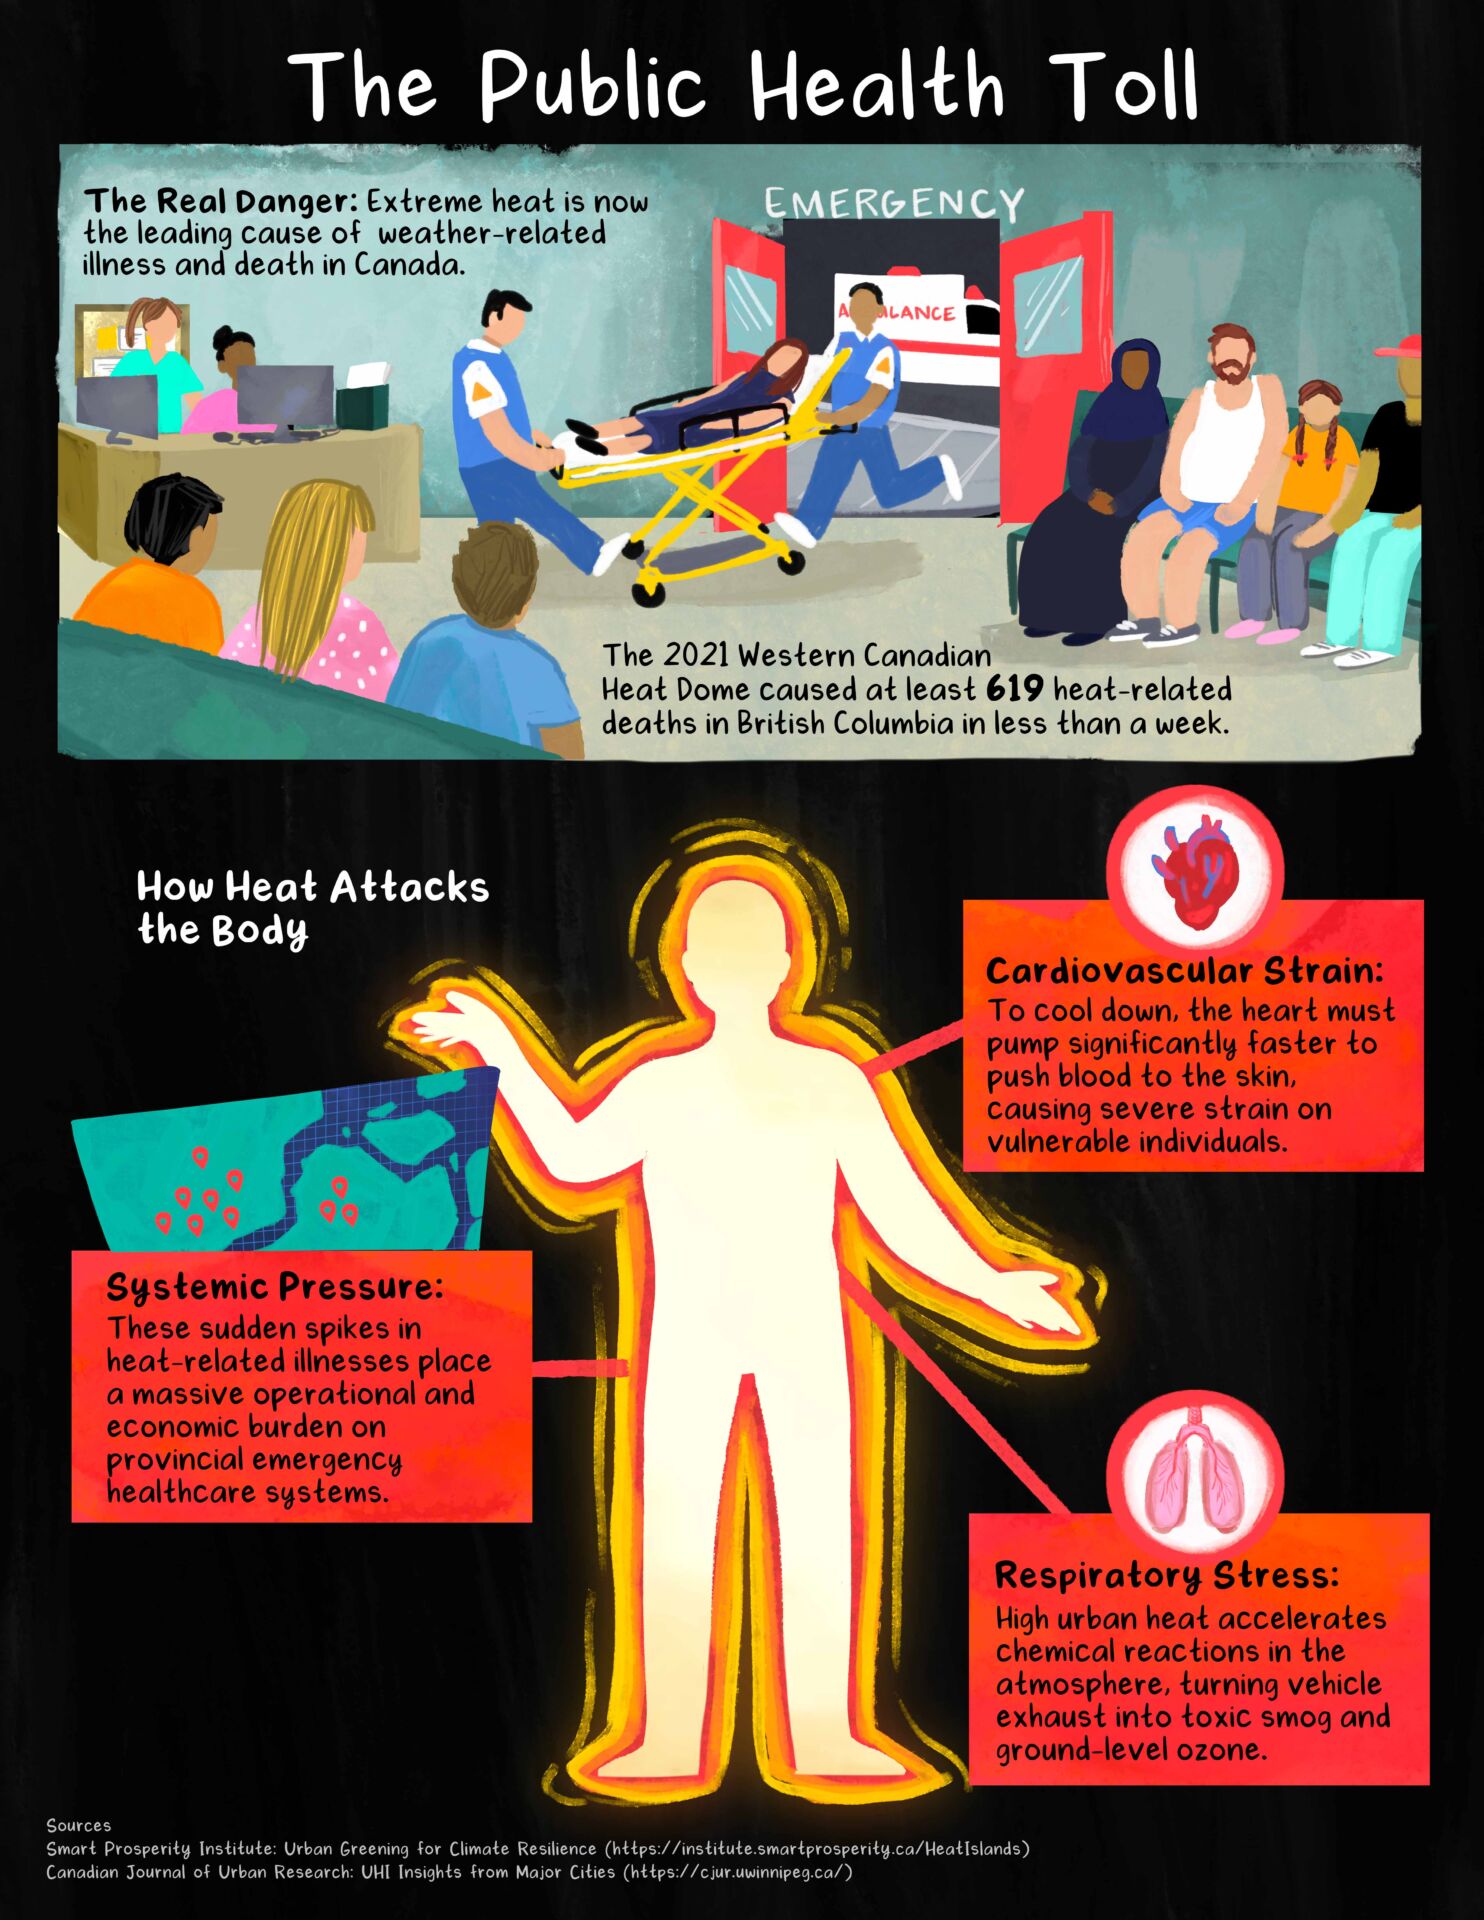
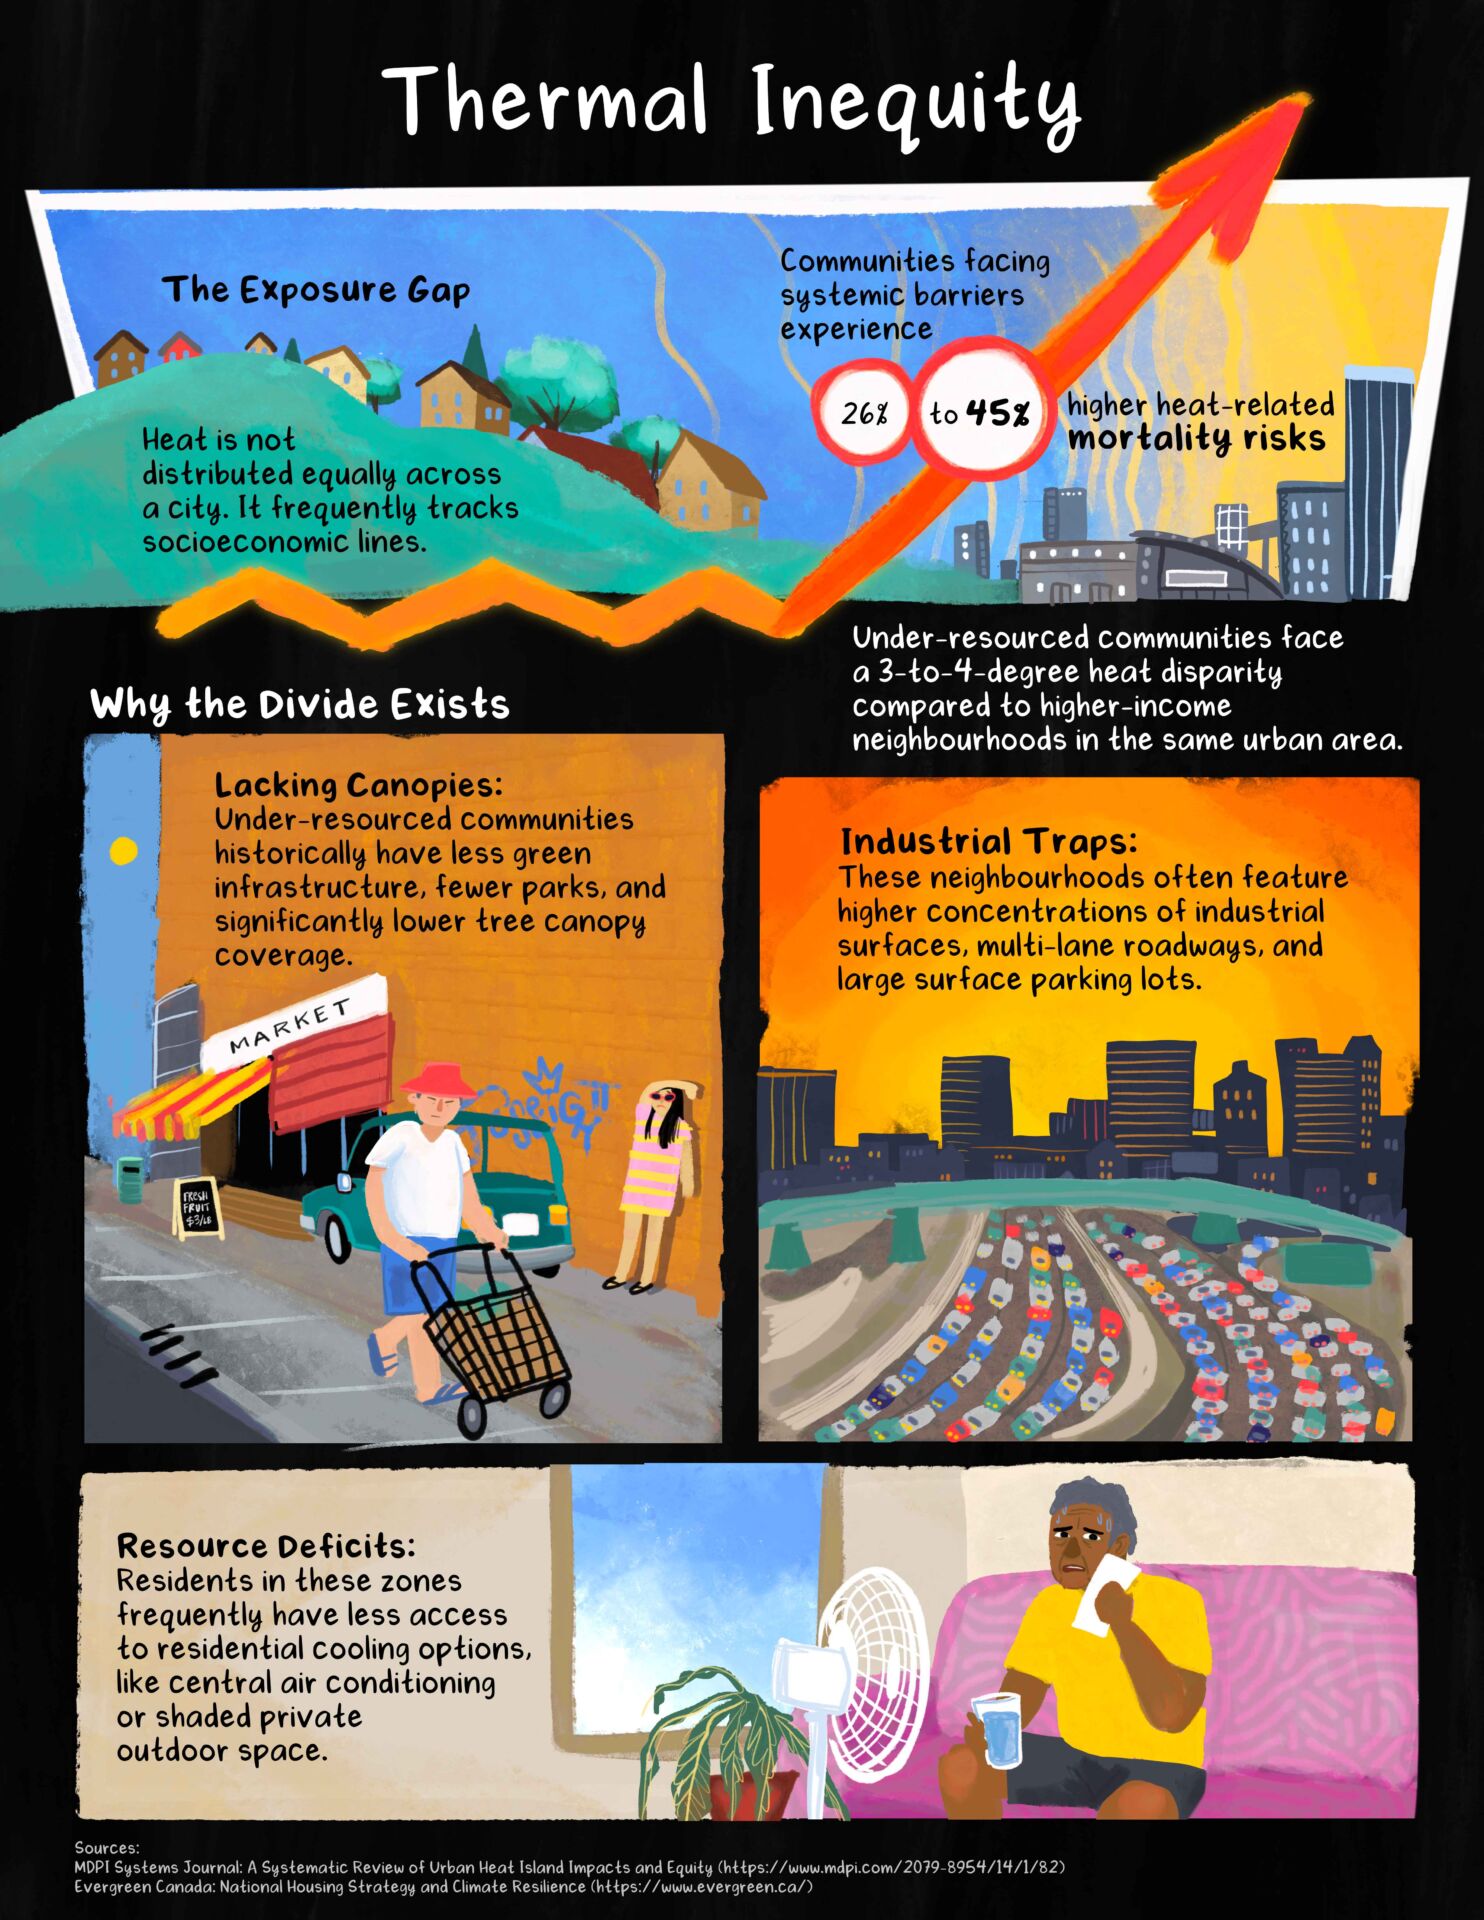
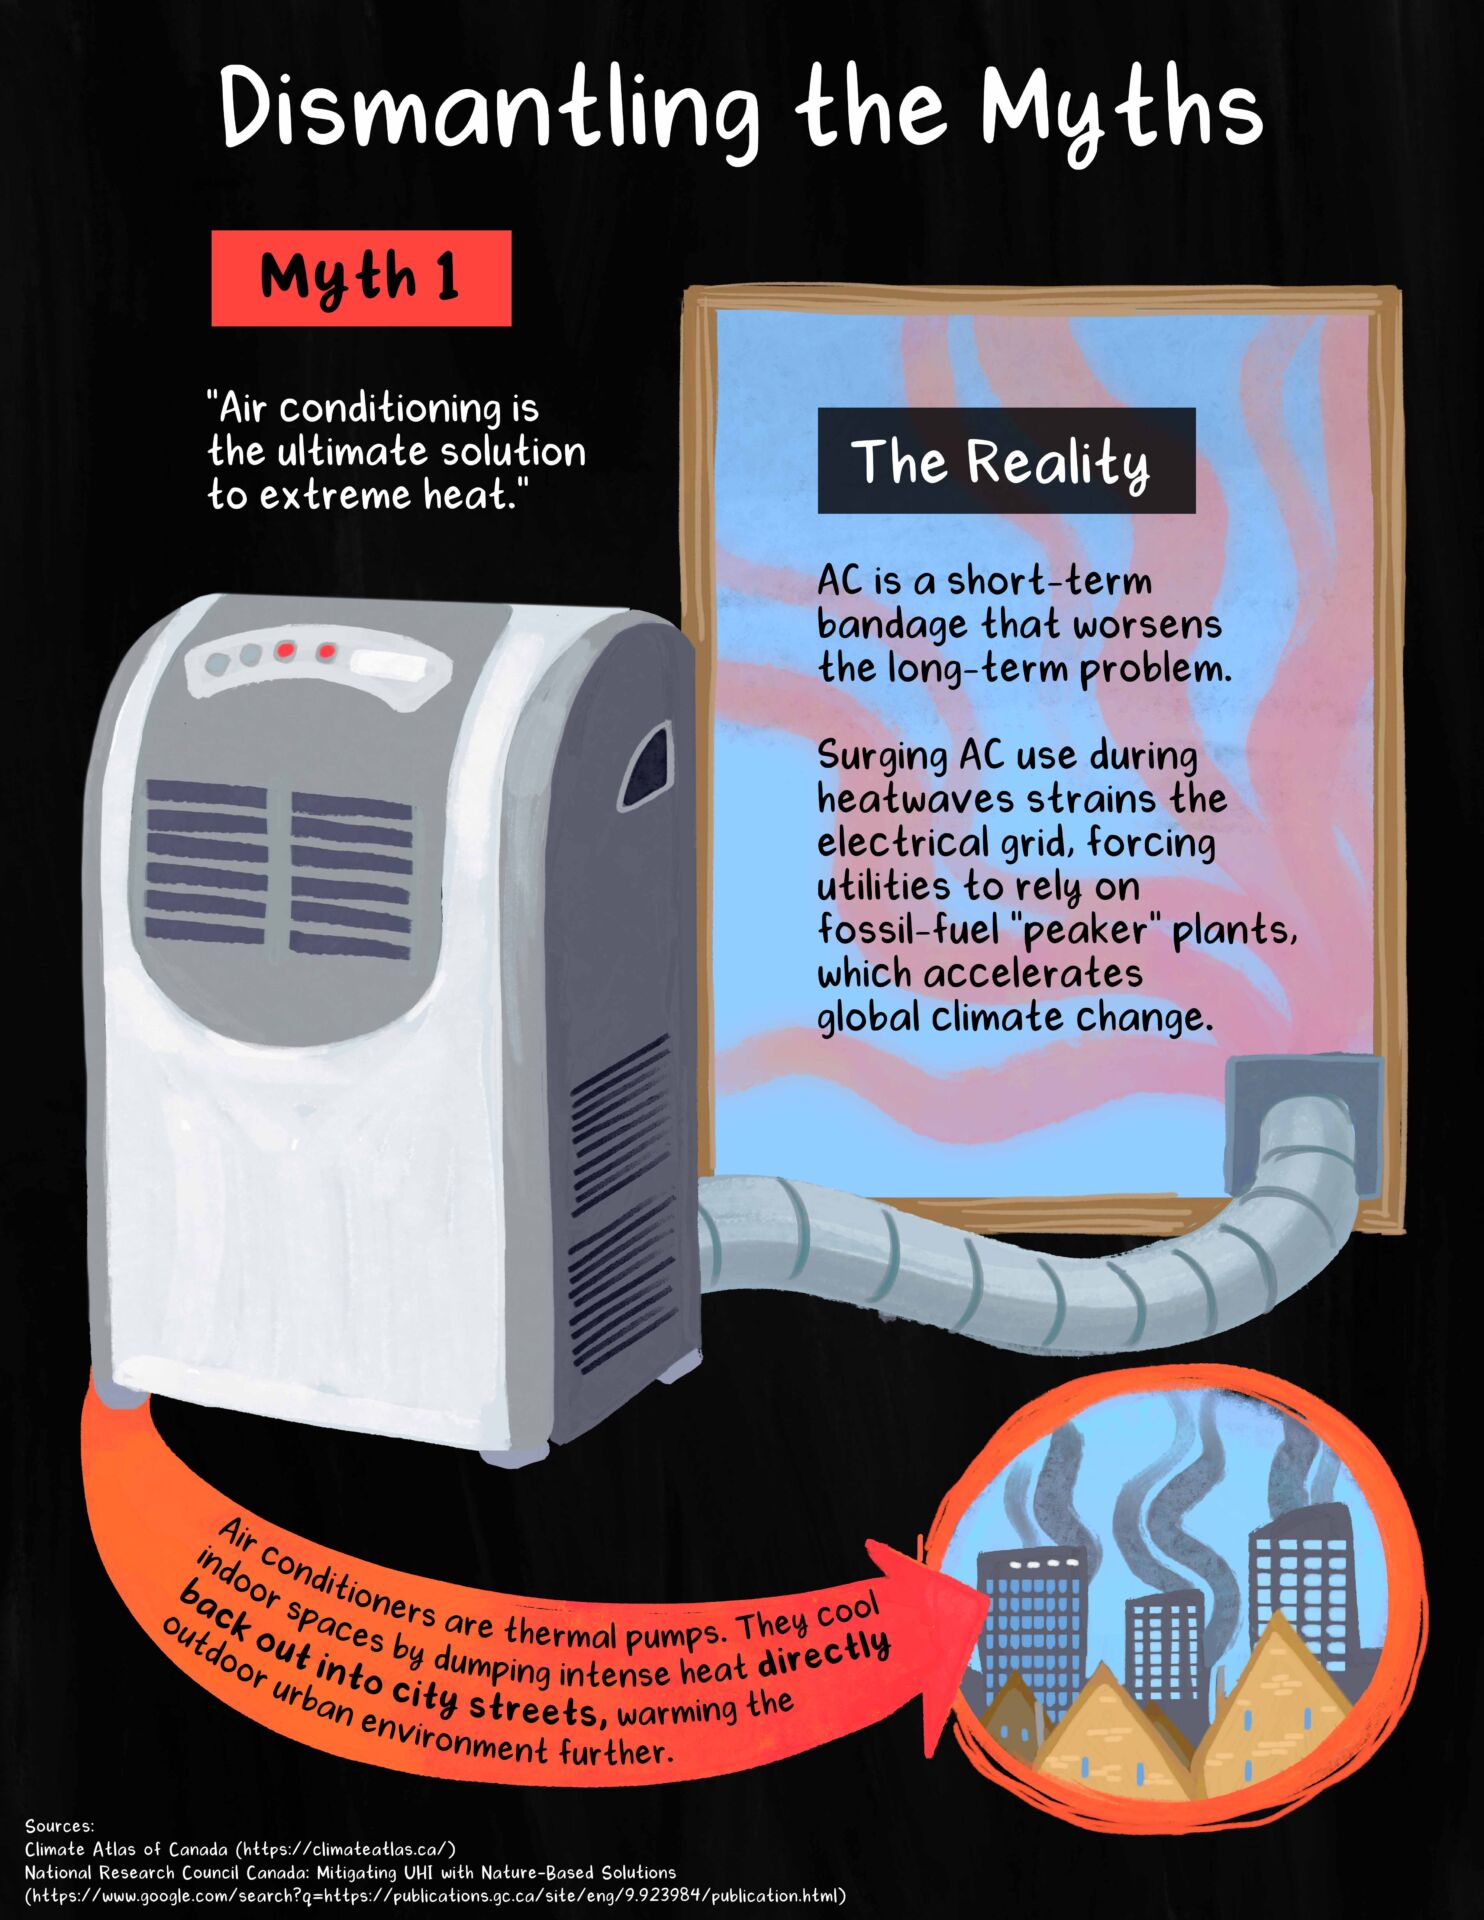
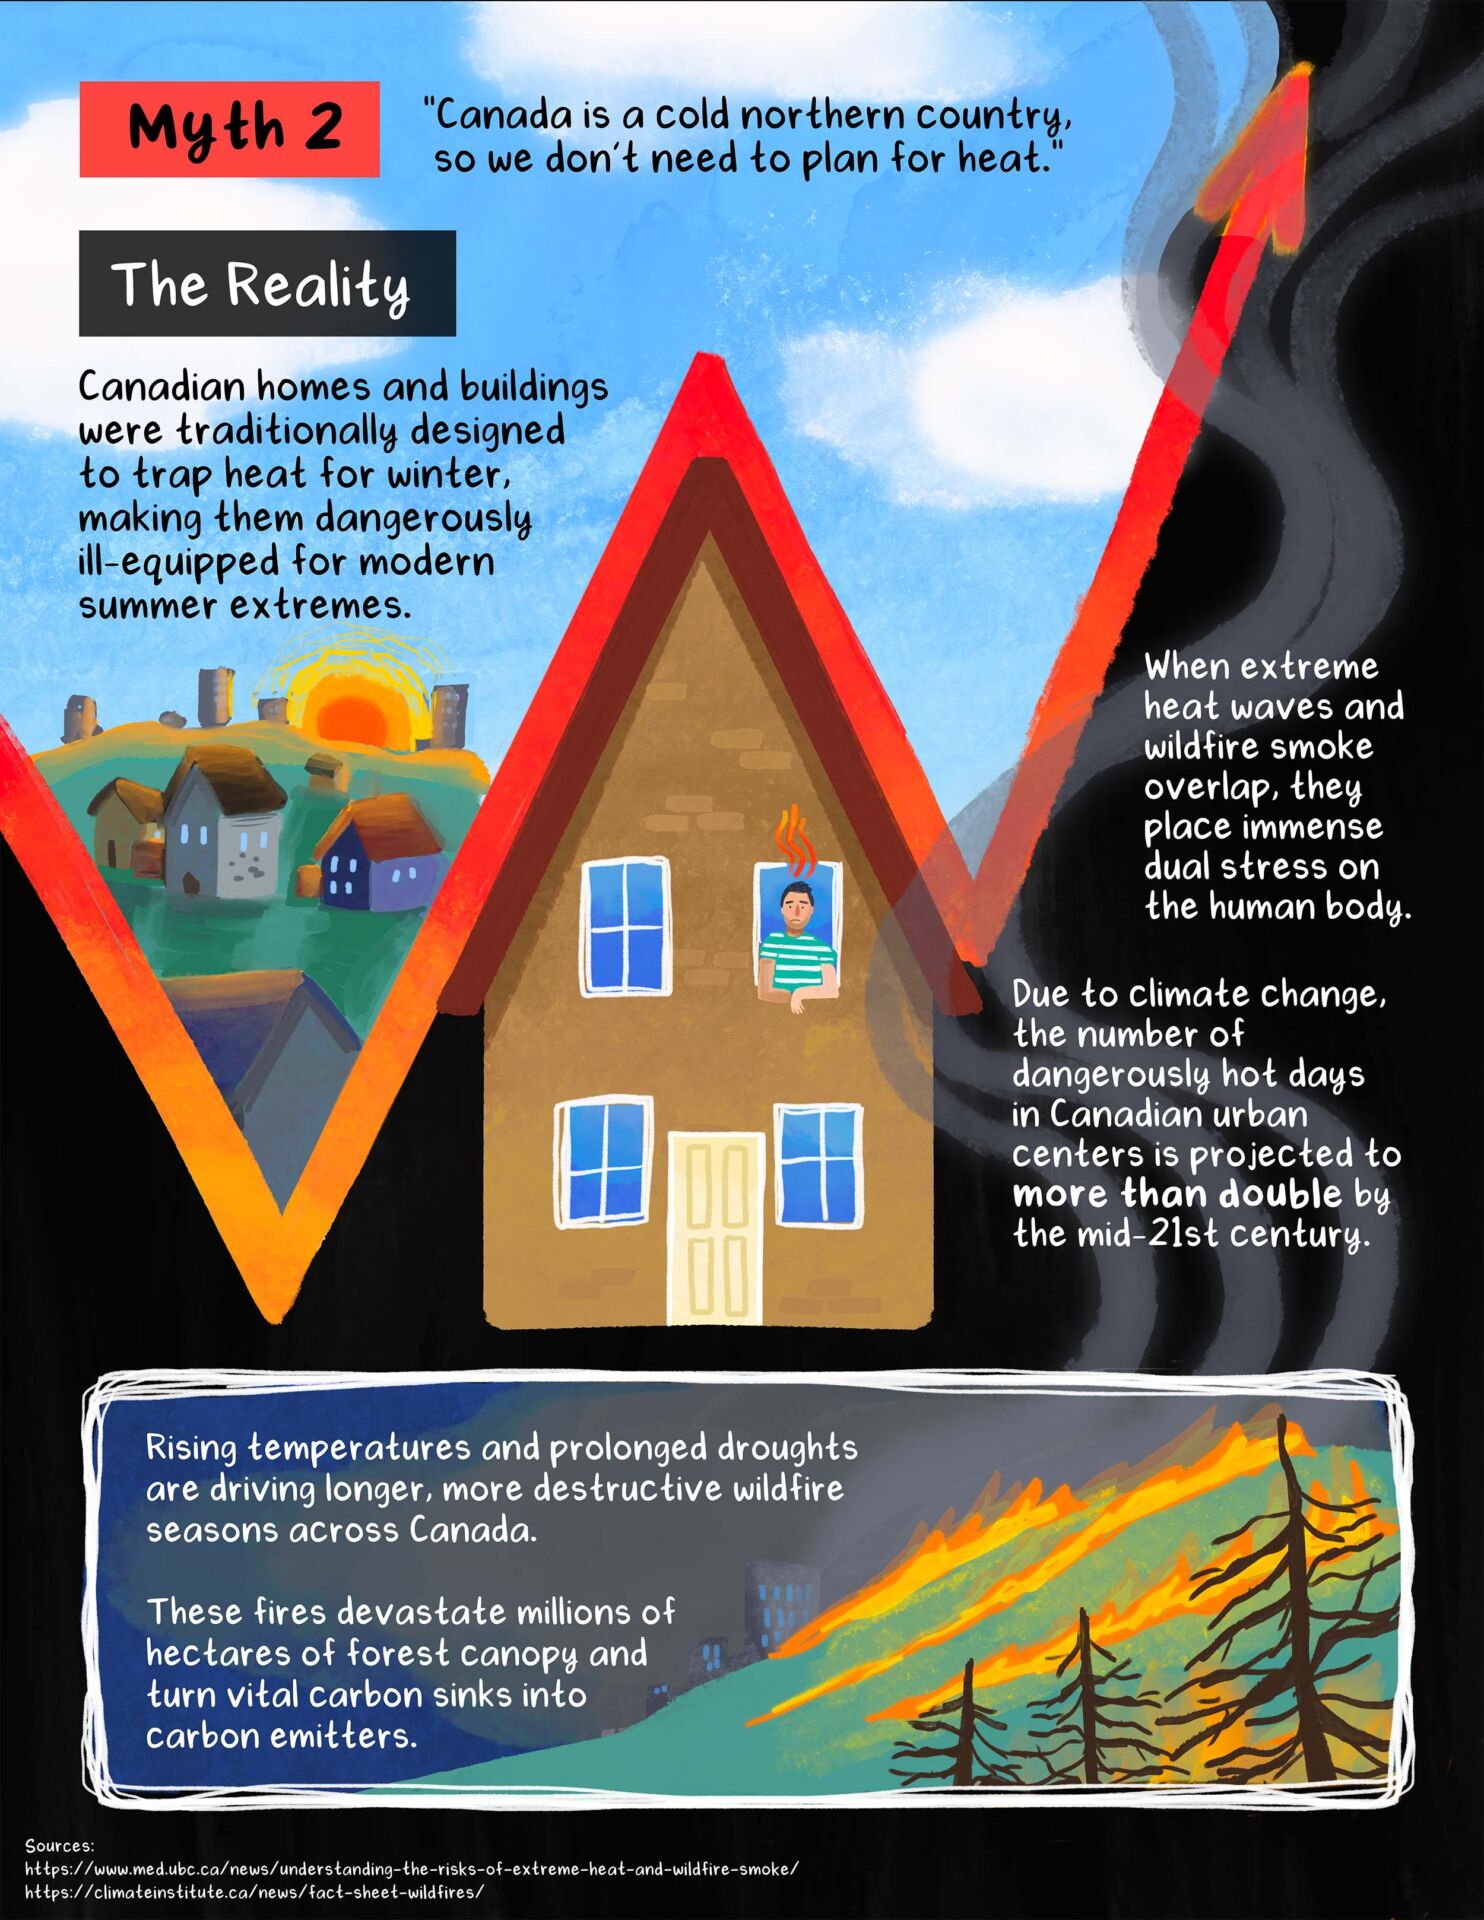
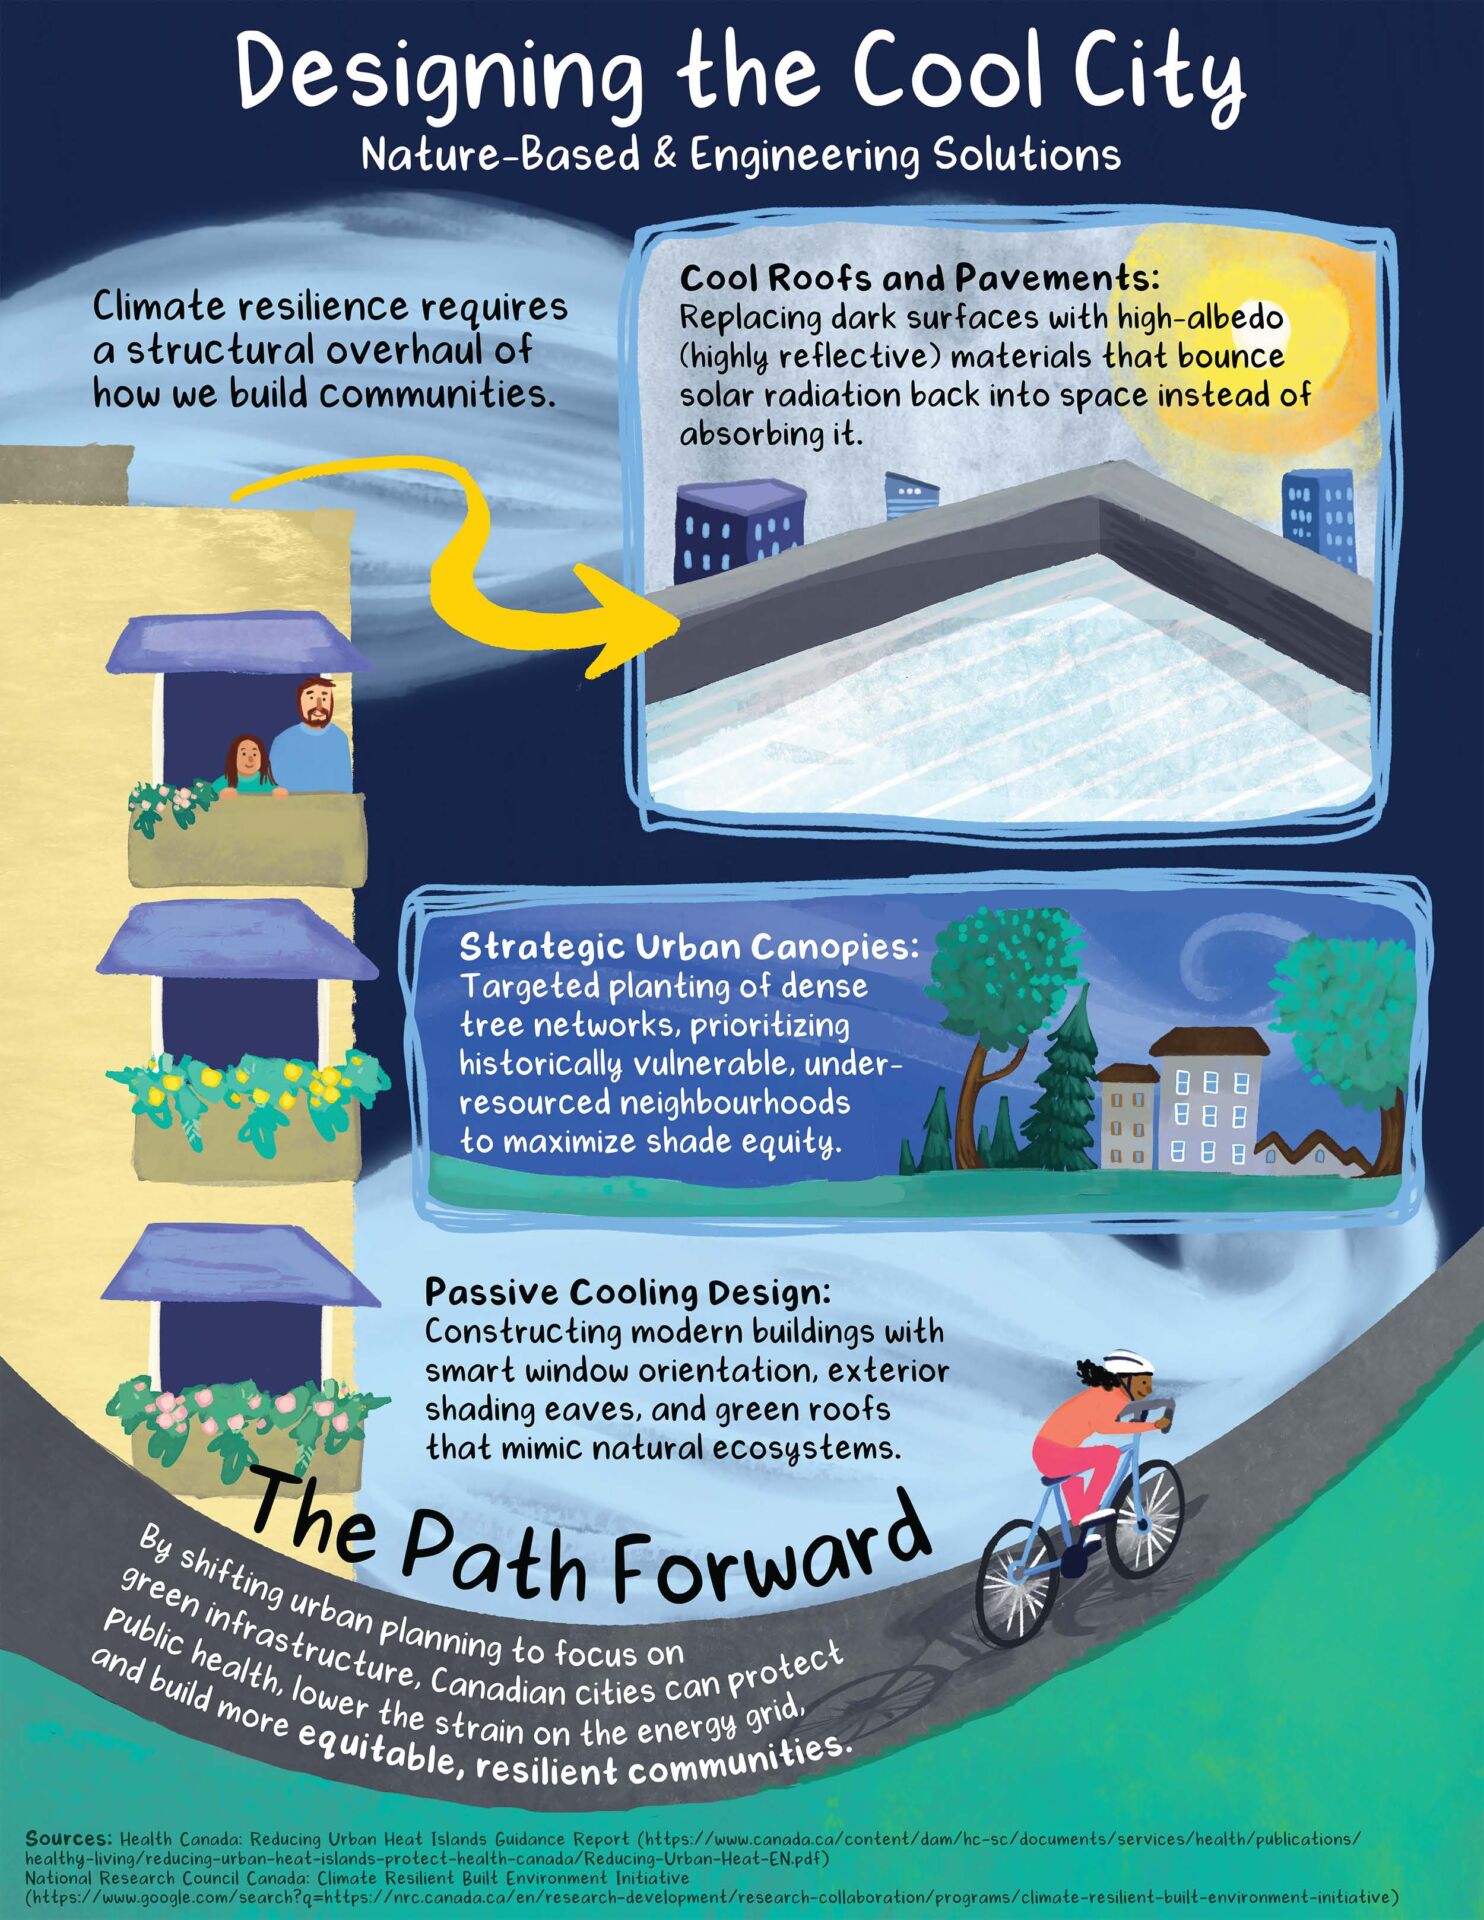
To demonstrate the power of visual storytelling for complex public health and climate topics, our team conceptualized and designed The Invisible Oven: How Canadian Cities Trap Heat and Harm Health. This eight-page visual report tackles the Urban Heat Island (UHI) effect. We wanted to give our clients a tangible example of how data-heavy research can be transformed into a deeply engaging, accessible narrative.
Illustrated in a dynamic, comic-book style, the digital report breaks down heavy academic concepts into clear chapters and powerful visual metaphors. By pairing hand-drawn typography with thoughtful page layouts and custom character illustrations, the final report offers a visual roadmap for readers.
Ultimately, this piece proves that vital research and policy data doesn’t have to be buried in a dry, text-heavy PDF. With the right creative direction, it can become a compelling, human-centered story that is impossible to ignore.